helloabc/iStock via Getty Images
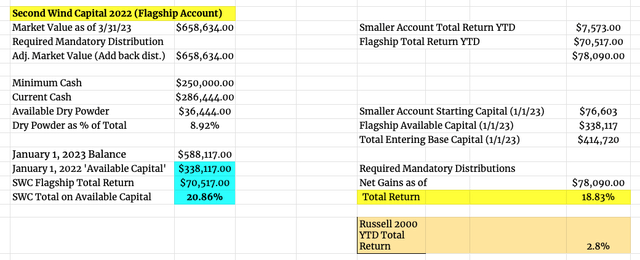
As an exceptionally transparent author on Seeking Alpha, at least when it comes to sharing and showing my actual (total return) performance, I write to share my Q1 FY 2023 results. During Q1 2023, on a blended basis, as I actively manage two equity portfolios, my total returns was +18.8% vs. +2.8% for the Russell 2000 (IWM). Please note, in the flagship account, since June 2020, as the steward of some family capital, in the flagship account, I’ve been tasked with maintaining at least $200K in cash. That number was bumped up, slightly, in early 2022, to $250K. Therefore, in FY 2023, my entering base of available capital was $338.1K.
Enclosed below is the summary sheet of actual Q1 FY 2023 Performance:
Author’s Chart
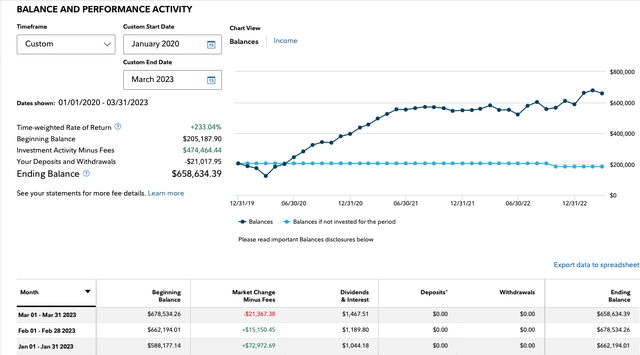
Also, please note, in the Appendix section, I share the actual Fidelity Performance numbers. This way, readers can see a snapshot containing actual returns and the monthly cadence.
Cognitive Dissonance
As a full time investor and writer, on Seeking Alpha, since May 2020, when it comes to portfolio performance, it’s remarkable how the vast majority of readers simply either aren’t aware or seem to pay very little attention to total return. Whether you’re retired, approaching retirement, or at the opposed end of the spectrum, in your mid to late 20s, and just getting acclimated to investing, total return is far and away the most important factor. Yet, shockingly, I find so few retail investors pay any attention to it.
On Wall Street, the quality of a person’s thought process and their total return performance, measured over a period of time, are paramount. Hedge fund founders, folks that have consistently generated impressive total returns have personal net worths tallied in the billions. Yes, that is billion, with a ‘B’.
In fact, according to Forbes, Ken Griffin (Citadel) is worth $35 billion. Jim Simons (Renaissance Technologies) is worth $28.1 billion. Ray Dalio (Bridgewater Associates) is worth $19.1 billion. David Tepper (Appaloosa Management) is worth $18.5 billion. Steve Cohen (Point72 Management) is worth $17.5 billion. I’m guessing the vast majority of readers have heard of the Top 5 High Priests of the Hedge Fund world. That said, if we move further down the list, I’m guessing most readers haven’t heard of other members of the Top 20, including Michael Platt (BlueCrest Capital Management – worth $16 billion), Israel Englander (Millennium Management – worth $11.5 billion), Philippe Laffont (Coatue Management – worth $6.9 billion), John Overdeck or David Siegel (Two Sigma Investments – each worth $6.8 billion), Bruce Kovner (Caxton Associates – worth $6.6 billion), or Andreas Halvorsen (Viking Global Investors – worth $5.9 billion). For perspective, to be ranked 20th, Paul Singer (Elliott Management) is worth $5.5 billion.
In 1933, when asked why he robbed banks, Willie Sutton replied, “Because that is where the money is”.
If we take many, many steps back, to a land far, far away from movers and shakers of Wall Street and hedge fund plutocrats, even if you are a financial advisor, entrusted with managing money, as a fiduciary, the quality of your thought process, customer service, and yes – total returns, within the context of a risk adjusted and tailored investment strategy matter.
Remarkably, hence my cognitive dissonance, at least on Seeking Alpha, in my experience anyway, very few readers seem to focus on total returns. There is nothing more confounding than this phenomenon! On a daily basis, I constantly see articles trending about three topics:
- Reaching for Yield: Articles recommending stocks or financial instruments with 8% to double digit yields.
- Market Timing: Articles written about jumping in and out of the market, based on some chart or some ratio or some other arbitrary factors (how about we eat a bunch of caramels? – if you are a Good Will Hunting Fan). Yet, virtually no one on Wall Street can consistently time markets, at least not over long periods of time. Despite the empirical data suggesting the average retailer investors can’t consistently and effectively time markets, far too many people are looking for shortcuts and think they can defy the odds.
- Whiz bang technology stocks: Articles written about fast growing (or formerly fast growing) technology stocks – valuation be damned! And speaking of a phenomenon, in her own right, Cathie Wood was the toast of Wall Street. However, her flagship fund ARK Innovation ETF (ARKK) literally blew up. This ETF is down an astounding amount, since its February 2021 high-water mark. Specifically, the ARKK ETF was down 67%, in FY 2022. Cathie’s early success, largely driven by owning Tesla during its epic run, catapulted her to fame. Since February 2021, though, ARKK has really struggled, and yet, retail investors and the financial media still loves to actively follow Cathie Wood’s every move.
Cognitive dissonance abounds!
A Quick Aside On Investment Strategies
Before I articulate the Second Wind Capital way, let me describe one of the more popular investment strategies, at least here on Seeking Alpha. On nearly a daily basis, we hear about and read about high dividend stock strategies. The way they are often described, these strategies mean being fully invested, at all times, and diversified, by owning a large portfolio of high yielding dividend stocks (usually more than 30 stocks). The focus is 100% on maximizing a blended current portfolio yield. What is really confusing is that many of these popular stocks, contained within this popular strategy, have gotten taken to the woodshed. And yet, we see lots of articles about buying hand over fist.
Wait a second – how can anyone, who is following the strategy, be buying anything hand over fist – when they are, by definition – already fully invested?
As there are 10K baby boomers retiring each day, and there are tens of millions of retirees that simply haven’t saved enough for retirement, at face value, I get the appeal of a blended portfolio, yielding 8% to 9%. Again, though, the only thing that really matters is the quality of the thought process, total returns, and how much risk is being taken. There are no ‘do overs in retirement’ and principal needs to be safeguarded.
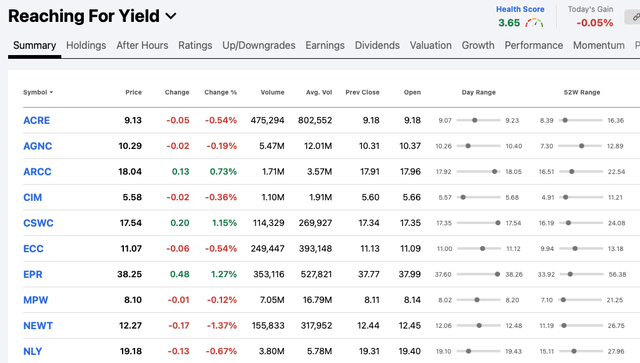
And as Seeking Alpha makes it really easy to track a number of different stocks and portfolios, for my academic purposes only, I’ve created a ‘Reaching For Yield’ tracker portfolio. I’m simply interested in periodically observing how some of the most highly and widely recommended high yield dividend stocks are actually performance.
Let’s start with Medical Properties Trust, Inc. (MPW), which is down over 50%, over the past year, on a total return basis, of course, including dividends. Lo and behold, as of April 6, 2023, year-to-date 2023, there have been 40 free site articles written on MPW.
And when I scan the list, the vast majority of these high yielding dividend stocks are sitting relatively close to their 52 week lows. The better performing names on the list are still well off their 52 week highs.
For example, Annaly Capital Management, Inc. (NLY) is frequently recommended, for retirees, and it has performed poorly. Other highly touted high yield dividend stocks have also performed poorly, including: Ares Capital (ARCC), Capital Southwest (CSWC), Chimera Investment Corporation (CIM), EPR Properties (EPR), NewtekOne Inc. (NEWT), and Oxford Lane Capital Corporation (OXLC), among others. Even the highly popular PIMCO closed end funds, PIMCO Corporate and Income Opportunity Fund (PTY) and PIMCO Dynamic Income Opportunities Fund (PDO) have performed really poorly, over the past year.
Seeking Alpha

Seeking Alpha
So if I were a retiree and I was following these high yield dividend stock strategies, by definition, I would be fully invested, long a portfolio of 30 to 50 different high yield stocks (including BDCs, ETFs, and closed end funds, etc.), and my total return would’ve been poor, at least over the past twelve months. Moreover, from a volatility, risk management, and drawdown perspective, it is hard to fathom that any of these strategies have generated attractive total returns over the past few years, relative to the S&P 500. If retirees want to take a lot of equity risk – why not just buy the S&P 500 (SPY)?
Incidentally, in October of 2022, with a different pool of capital, I shared a newly created $300K Investment Grade Bond portfolio, that I curated on behalf of my parents, who are 72 and 74 years old.
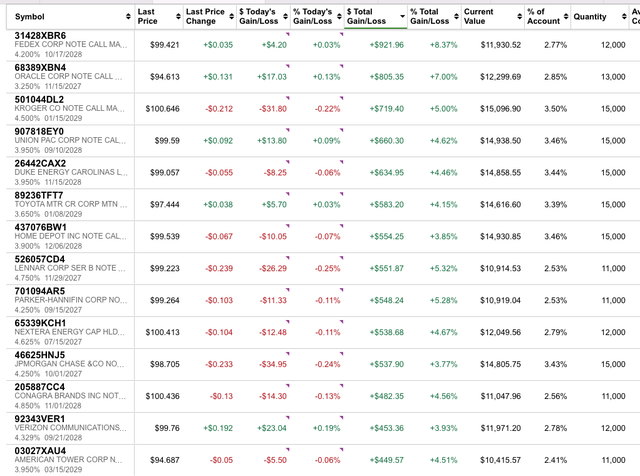
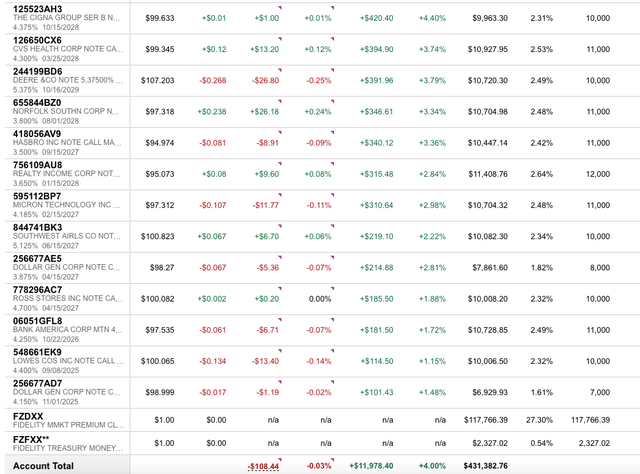
Lo and behold, this portfolio was constructed on October 5, 2022 (when the first $250K tranche was invested) and on October 22, 2022 (when the second $50K tranche was invested). This is truly Buy and Hold, as we haven’t touched the portfolio and have no intention of selling any bonds, as my parents plan to hold all the bonds to maturity (unless there is some unexpected event or one of the bonds unexpectedly get downgraded into junk territory). In the meantime, this portfolio spits off a $1,050 per month, in current yield, and as of April 6, 2023, and the mark to market unrealized gains are just shy of $12K, or a 4% unrealized gain.
On a mark to market basis, within portfolio of twenty seven bonds, the FedEx Corp. (FDX) bonds are up 8%, Oracle Corp. (ORCL) bonds up 7%, Kroger Company (KR) bonds up 5%, Lennar Corporation (LEN) bonds up 5%, Parker-Hannifin (PH) bonds up 5%, NextEra Energy (NEE) bonds up 4.7% Union Pacific (UNP) bonds up 4.6%, and Duke Energy (DUK) up 4.5%. Please note, 27 out of 27 bonds all have unrealized gains. Even Bank of America (BAC), Norfolk Southern (NSC), and Southwest Airlines (LUV), all in the news, and not for good reasons, are up.
When you’re sitting higher up in the capital structure, in corporate bonds, so well above the equity, preferred, and junior bond levels, and when you own a portfolio of bonds, in high quality underlying companies, most of your total return is a function of the yield, at the time of purchase and how attractive that yield was/is, relative to treasuries, as the underlying credit spreads tend to remain fairly consistent.
Fidelity
Fidelity
Just above, as you can see, enclosed is the actual portfolio of bonds, so people can see the underlying cusips. I’m guessing, since inception, October 5, 2022, that this $300K IG and SWAN like portfolio has crushed the total returns of most high yield dividend stock portfolios. In addition, as I said above, when it comes to this portfolio, this is a buy and hold portfolio. This portfolio delivers consistent income and benefits from far less volatility.
The Second Wind Capital Way
Let me explain the Second Wind Capital way. I am a small cap value and special situation investor. The vast majority of my time is spent picking stocks. And my investment process consists of synthesizing company conference calls, reviewing the 10-Ks and 10-Qs, speaking with management, and constantly thinking about valuation and risk/ reward. Yes, I’m aware of the macro backdrop, but I’m not a market timer. My process is 70% art and 30% science, as during normal times, the market is relatively good at discounting current information, such as financial statements and recent earnings results relative to consensus estimates.
The alpha is created by buying good businesses, when they are out of favor. Or by buying mediocre businesses, at really attractive prices. As the small cap value style is straight forward, on the Special Situation side, a great actual and recent example, was when I loaded up on Netflix (see here and see here) (NFLX), as Netflix was deeply out of favor, throughout most of the summer of 2022.
Switching gears, and just to be clear, unlike IG bonds, small cap stocks are super volatile. Many of these stocks have limited buy side ownership (mutual funds, pension funds, insurance companies, endowments, etc.), so these stocks can trade wildly and erratically. Far more often than not, during times of stress, these businesses can trade far apart from their intrinsic value. Therefore, in order to traverse this rugged terrain, and to play in this higher risk / high reward arena, you have to have conviction in your stock picking abilities and be willing to stomach drawdowns.
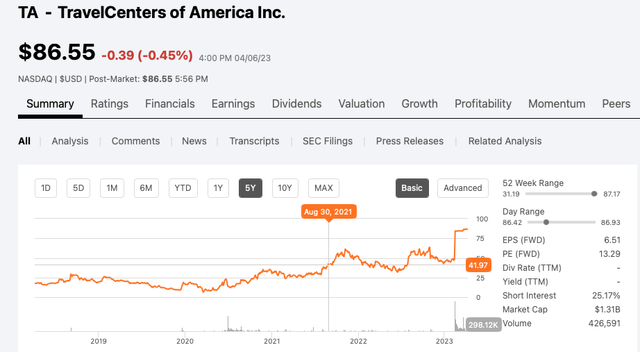
Year-to-date, in FY 2023, the biggest driver of Q1 FY 2023 total returns was TravelCenters of America (TA). TA is a stock that I originally bought and recommended at $41, back on September 1, 2021. Before BP p.l.c. (BP) agreed to buyout the company, for $86 per share, TA shares moved – get this – wildly, erratically, and traded far away from intrinsic value.
Seeking Alpha
From the time of original purchase, September 1, 2021, to the time of the buyout news, February 16, 2023, so just shy of 1.5 years, TA’s underlying fundamentals only got better. The company’s Adj. EBITDA got dramatically better and I correctly worked out that then relatively new CEO, Jon Pertchik, was the perfect executive to put in motion this turnaround. Had I let the tail wag the dog, and let the wild volatility in TA’s stock price sway my conviction, conviction strengthened by my fundamental analyses, then I might have missed taking advantage of this big win.
That said, again, small caps are super volatile, and it is common to watch decent sized unrealized gains move to losses, in the short term, even if the underlying fundamentals haven’t exactly chanced.
Let me give you two example:
Entering FY 2023, Chart Industries (GTLS) is one of my core Buy and Hold investments. I’m long shares with a cost basis of $127. On March 7th and 8th, of this year, GTLS shares traded over $152. I think GTLS shares are worth $200 plus, so I wasn’t interested in trading the stock to capture $25 points.

Fidelity Portfolio Snapshot
Secondly, and perhaps more illustratively, Mesa Air Group Inc. (MESA) is another core Buy and Hold investment. As you can see below, I bought shares, at $2.40 per share, on January 20, 2023. Lo and behold, on March 9, 2023, MESA shares traded up to $3.82. On paper, that was a 59% unrealized gain, in less than two months. Again, though, in this account, I wasn’t a seller, at $3.82, as I think MESA could be worth $5 (or more).

Fidelity Portfolio Snapshot
My long winded point is that the inherent volatility associated with small caps is far too much for most people to handle. Far too often, notably these days, I find way too many people just want to try and run between raindrops, and are really just day traders. They are too afraid to put real capital at risk. That is what happens during bear markets, people’s nerves get frayed. Well, if you want to capture the big upside, then you have to be willing to ride the cycles and play the long game. Don’t get me wrong, really since Q4 FY 2021, this has been a nasty bearish cycle for many small caps.
In the short term, as I’ve said twice, and now three times, small caps can notoriously trade wildly, erratically, and during times of stress, far more often than not, they trade far away from their intrinsic value.
In terms of the positive drivers of Q1 FY 2023 outperformance, the following stocks led the way:
Top Five Realized Gaining Positions:
- TravelCenters of America: 50% of the net gains
- Mesa Air Group (I sold half, at $3, the low cost $2.20 cost basis shares): 12% of the net gains
- DermTech Inc. (DMTK): 9% of the net gains
- iMedia Brands (IMBI): Made almost 100% and this drove 9% of net gains
- eHealth, Inc. (EHTH): Sold 30% and still own the rest of the position. This drove 5% of net gains.
Top Five Realized Losing Positions:
- PROSHARES ULTRA BLOOMBERG (BOIL): Took a decent sized loss here, at $6 per share. This dinged performance by 10%.
- Microbot Medical (MBOT): This was a very small legacy bet, originally purchased in early 2022. I got stopped out, for a 60%, at $2.95 per share. This dinged performance by 8%.
- Yield10 Bioscience (YTEN): This was and still might be a great setup, but, as of April 6, 2023, management hasn’t secured FY 2023 financing / funding, so time is running out. I oversized this one. This dinged performance by 5%.
- Playtika Holding (PLTK). This was a legacy bet, from the summer of 2022. During Q1 2023, I sold half, at $11, and took the 30% loss. This dinged performance by 5%.
- Express Inc. (EXPR): On February 1, 2023, I exited my entire and very oversized position, at $1.23 per share. This was only a 12% loss, but I dramatically oversized this one. I realized I was wrong and took my medicine.
Putting It All Together
As an exceptionally transparent author on Seeking Alpha, when it comes to documenting performance, today’s article was written to share my Q1 FY 2023 results. An amazing January 2023 really helped me put a lot of runs on the board, as my January Effect 2023 playbook worked great. In February 2023, the TA buyout by BP p.l.c. was a big win and a great example that high quality fundamental value research can really drive longer term performance.
If you build a portfolio of small cap value and special situation stocks, the returns can be lumpy due to inherent volatility. However, as long as you have a reasonably diverse portfolio, if you can stomach drawdowns, and you have conviction in your ideas, small caps value is one of the best ways to generate a lot of alpha. Sadly, as of present day April 2023, the market is dominated by algos, ETFs, and day traders. And as I’ve mentioned, the vast majority of small caps, notably companies with market capitalizations, sub $500 million, just don’t benefit from the institutional supported afforded to so many large capitalization stock. However, these big departures from intrinsic value, and this is very much an art, are what create the alpha rich opportunities.
Good luck to everyone during Q2 FY 2023! And here’s to all the intrepid small cap value and special situation investors.
Appendix
As you can see, in the main flagship account, January 2023 was amazing, February 2023 was very good, driven by BP p.l.c. (BP) buying out one of my top 5 and longer term Buy and Hold positions – TravelCenters of America (TA) – for $86 per share. March 2023 was a lot tougher, as the Russell 2000 down 5.2% during the month driven largely by Regional Banking crisis and contagion fears.
Fidelity Performance Tracker
Here is the snapshot of the second and smaller equity portfolio.

Fidelity Performance Tracker
Editor’s Note: This article discusses one or more securities that do not trade on a major U.S. exchange. Please be aware of the risks associated with these stocks.

